If ever there were a time to not pull out your crystal ball, now would be that time. Not too much of what it would tell you, is going to be good news. Unfortunately for a lot of finance organizations, CFO’s and financial analysts, they can’t avoid it. It’s incumbent that they try and determine or forecast what will happen over the next quarter or the next four quarters, to their organization’s revenues. Obviously, the value of information that can accurately predict or determine the likelihood of future events, future trends or likely behavior from historical and current data patterns, in finance and accounting would be huge. Especially right now.
Historically, economic forecasters have had a knack of neglecting to foresee crises. Whether it’s myopic in nature or it’s a habit baked in optimism or it’s simply an unwillingness to see the forest for the trees, the fact is, economic forecasting has often been described as a flawed science. Problems arise when many conclusions do not come from objective economic analysis but instead are regularly shaped by personal beliefs on how the economy and its participants work. That inevitably means that the impact of certain policies will be judged differently.
If we unpack this observation, and expose it to 2020, history would appear to be repeating itself. Not many would have or did actually predict what has happened over the first four months of this year. In fact, prior to, all economic indicators revealed that the US economy was firing on all cylinders. Until it wasn’t.
So, was there a way to forecast this? Could some companies or industries have anticipated this and have been better prepared for the massive lack of revenue or the sudden dearth of cash flow? Some would say no, others perhaps maybe, we say yes.
Let’s look at GDP. Gross Domestic Product is defined as ‘an aggregate measure of production equal to the sum of the gross values added of all resident and institutional units engaged in production (plus any taxes, and minus any subsidies, on products not included in the value of their outputs)’.
It measures the monetary value of the aggregate production of goods and services in a country during a given time period (quarterly or yearly). Nominal GDP estimates make it possible to determine the economic performance of a whole country or region, and to make international comparisons. With that being said, having knowledge of the broader economy – either as a whole (Gross Domestic Product) or within an industry is, a lot of times, off the radar for many FP&A teams (and likely CFOs). They just don’t have the time or the bandwidth to concern themselves with it.
Our collective thinking at FYIsoft is, what if there was a way to understand how your company moves in relation to the economy? What if there was another layer of insight that could possibly predict or forecast how yours or your customers (revenue) would act? How would that help finance decision makers, analysts and CFO’s?
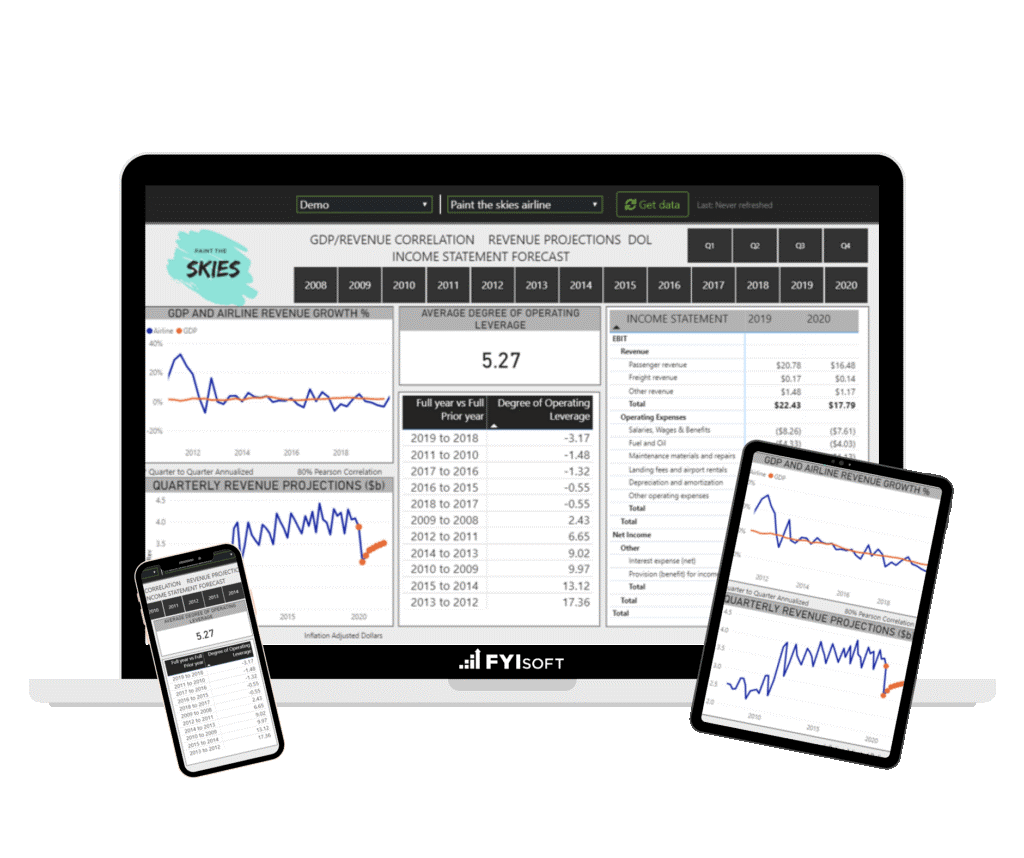
Here’s an example. Let’s say a factor of 100% means your historic revenue moves perfectly in sync with the same period historic GDP (i.e., growth). 50% would be a weak correlation, meaning your revenues move about half in step with the GDP. -100% would be exactly as you would think – GDP goes down and your business goes up.
Even in good times, revenue projections are always filled with uncertainty. But when the global economy is in turmoil and recovery times are unknown, forecasting is even more difficult. What if we could take the guesswork out of it? The AI engine behind AnalyticsFYI can analyze decades worth of historical data to determine how your company’s growth has moved in relation to GDP data. This correlation is then applied to leading analyst forecasts in our database that then can help finance teams, analysts and CFO’s more accurately project revenues for the next eight quarters.
The beauty of this, amongt other things, is that financial data is pulled directly from your general ledger, without the risks and errors associated with spreadsheets or manual exports. This ensures projections are always accurate and always based on real-time data. Another aspect? It would take a talented analyst 6-12 months to analyze comparable data and develop relevant projections. By then, new forecast models would make their projections obsolete. Lastly, we’ve made it so CFOs and analysts can begin using our AI-powered analytics software immediately, with ready-made features including robust templates, a wealth of key financial ratios and statistics, and industry bench-marking.
In closing, as the coronavirus pandemic continues, economists have rushed to update forecasts with dismal outlooks for the US economy, and projections that US GDP would falter have come from the leading analysts. As factories and stores are shuttered, there will likely be huge declines in manufacturing and consumer spending in the near future. In order to get ahead of it, you need data. You need accurate data and you need it quickly! If GDP data can help you with your financial forecasting, and budgeting and reporting for that matter, at this stage of the game, why would you ignore it, decline it or slough it off? The results of the last 4 months will be just as critical to forecasting your next four months and beyond and leveraging the AI engine in AnalyticsFYI could be just what the economy needs.